


PlotCapability
Web 5.0
Advanced, real-time monitoring of the safety and efficiency of electric generators.

A powerful monitoring tool
PlotCapability Web monitors the reactive power operation of power plants.
Through this application, it is possible to know in real time if a generator is operating within the safety zone. In addition, the user can also monitor under- and over-excitation limits (OEL, UEL) and voltage-dependent generator protections in real time.

PlotCapability Web runs a complete generator model for both round-rotor and salient-pole synchronous machines, considering saturation effects.
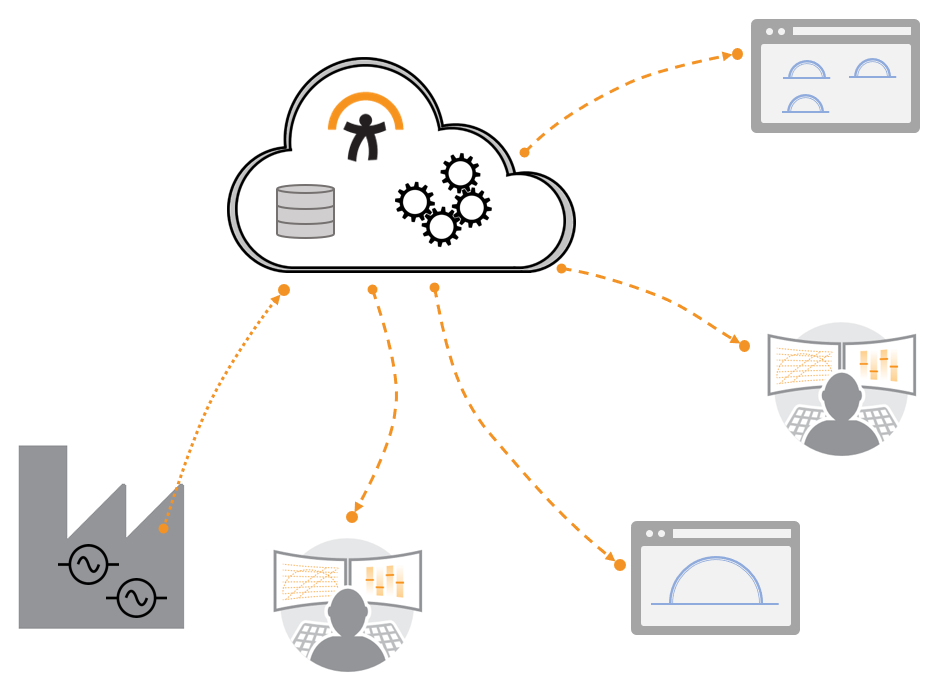
PlotCapability Web will automatically detect if the current operating point leaves the safe zone for the generator, alerting the operator with a visual alarm.
Online UX
Online
Offline
USD 250 p/unit
1 a 10 generators
Annual Subscription License
Extras: ask for quote.
Maintenance and updates included.
Price request
+10 generators
Annual Subscription License
Extras: ask for quote.
Maintenance and updates included.
Order a demo
Fill out the form and we’ll contact you as soon as possible.